Digital scholarship blog

Enabling innovative research with British Library digital collections

6 posts from October 2013

30 October 2013

Guess the journal!

Over recent months I’ve been working on-and-off with a collection of metadata relating to articles published since 1995 in journals the library have categorised under the ‘History’ subject heading. 382497 rows of data (under CC0) about publication habits in the Historical profession, which lend themselves to some interesting analysis and visualisation.

HJA_30Js_ii
To recap from previous posts on this blog and on another, I started this work by extracting words which frequently occurred within journal article titles. Having filtered out words whose meaning was fuzzy (‘new’, ‘early’, ‘late’, ‘age’) or whose presence was not helpful (‘David’), I was left with this list of topwords (I’ve avoided ‘keywords’, I just don’t like the word at the moment):

africa america archaeology art britain british china chinese cultural culture development empire england europe france historical history identity life making medieval national policy political politics power revolution social society state study women world

Next I created a .csv where each row represented an occurrence of a one of these 33 topwords in an article title. This totalled 209210 rows; and though this was less than the total number of rows, as many titles contained more than one of these words some articles were represented more than once.

Before we get to the fun bit, there are a number of problems with the data that need pointing out:

  • There are some odd gaps and declines in article volume for some journals around 2005. This isn’t due to actual publication trends, so we are working on why the data isn’t accurate – huge thanks to the Metadata Services team (especially Corine Deliot) for their hard work.
  • The volume of English language titles smother the various English, Italian and – notably thanks to Zeitschrift für Geschichtswissenschaft – German titles, leaving us with very Anglophonic data. I’d like to do some translating, but for now I’ll restrict myself to trends in English language articles.
  • The data isn’t smoothed by articles per journal issue (or articles per journal per year), thus ‘power’ journals are created on sheer volume of output alone (and, as we all should know and should hope to be the mantra of future academic publication, less can be more…).
  • The data includes reviews, though this isn’t necessarily a bad thing as it adds book titles to the list of titles mines (hence why ‘David’ is one of the unfiltered topwords).
  • Some words have multiple meanings (china) or are ill-suited to simple text mining (art), but then corpus linguists have known this for years.
  • Some journals in the data are not really history journals, but rather politics and current affairs publications with a sprinkling of historical content. Archaeology is similarly problematic, but I’ve left these journals in for now out of a sense of GLAM solidarity.

Despite all of this, I’d like you to play a game of guess the journal from a network graph; a network graph representing data for the 30 highest ranking English language History journals in terms of article volume published between 1995 and 2013. On one hand you doing this will help me validate that my data – and this particular way I’ve chose to represent it (a force-directed ‘Force Atlas’ graph generated using Gephi) – has some value; Adam Crymble has a nice example of how this can be useful. On the other it should be a bit of fun.

HJA_30Js_i
So, onto that long promised fun bit. Knowing the following:

  • That each number on the network represents a journal name,
  • that each word within square brackets is a topword from an article title,
  • that the thickness of the line between the word and the number represents the occurrence of that topword in the numbered journal,
  • and that the colouring represents the group (or modularity) the numbered journal has been assigned to based on the structure of the network;

can you guess which number the following journal is represented by? (Or is this whole thing meaningless?)

  • Antiquity
  • English Historical Review
  • International Journal of African Historical Studies
  • International Journal of Maritime History
  • Journal of American History
  • Journal of Asian Studies
  • Journal of Social History
HJA_30Js
Bimodal Force Atlas graph for History Journal Articles published 1995-2013. For more detail (and with apologies for the fuzzy compression above, you'll probably need it!), download the PNG or SVG version.

To start of you off, I’ll gift you that American Historical Review is number 34 – right at the heart of the network, not surprising given the volume of output. I’ll also give you a little derived data to help you make up your mind.

Answers in the comments please!

@j_w_baker

29 October 2013

Off The Map Winners Announced

Last Wednesday I was very pleased to attend an award ceremony at Nottingham Contemporary art gallery for the Off the Map 2013 competition, which challenged videogame design students to turn historic maps and engravings from the British Library collections into a 3D environment using Crytek's CRYENGINE software. The award event was part of GameCity8, an annual festival of videogame culture held in Nottingham. You can read more about the competition in my earlier blog post about the launch.

There were a number of brilliant entries received and of these, two noteable runners up both from the University of South Wales in Newport, where students can study Computer Games Design at one of the most established Games Design courses in the UK. These teams were called Asset Monkeys and Faery Fire; you can see flythroughs of what they created in the YouTube clips below:


Taking first place I am delighted to report that the winning team is Pudding Lane Productions, comprising of six second-year students from De Montfort University, Leicester. I blogged about their visit to the Library back in February and in addition to studying the British Library resources provided, they arranged a fieldwork outing to York, to examine, photograph and sketch the architecture of the buildings; enabling them to model authentic buildings for their virtual environment. The flythrough of their work, which you can see in the clip below, is breathtaking:


My colleague Tom Harper from the British Library's Map department was one of the judges and he said:

 “Some of these vistas would not look at all out of place as special effects in a Hollywood studio production. The haze effect lying over the city is brilliant, and great attention has been given to key features of London Bridge, the wooden structure of Queenshithe on the river, even the glittering window casements. I'm really pleased that the Pudding Lane team was able to repurpose some of the maps from the British Library's amazing map collection – a storehouse of virtual worlds – in such a considered way.”

 It has been pleasing to see that competition has been featured widely in the press; including WiredMailOnline and The Telegraph. I think that it is wonderful that the students' work is being showcased to as many people as possible. All the contestants worked hard and I am impressed with the end results, they surpassed my expectations. Personally I have enjoyed working on such an innovative and satisfying project, and I very much hope to work on future collaborations with the videogame industry.

23 October 2013

Visualising Joyce....yes I will Yes!

Dotted all around the British Library are lovely pieces of artwork which our colleague, Dr. Jennifer Howes, Curator of Visual Arts looks after.

One such piece is Joe Tilson’s “Page 1, ‘Penelope’” which is usually on permanent display in the British Library’s foyer but from this month through February 2014 it is being exhibited at the Barbican Art Gallery, as part of their ‘Pop Art Design’ show.   


Sept 2013 007
Created in 1969, it was donated to the British Library by Klaus Anschel in 1998, in loving memory of his wife, Gerty. Leo Stevenson removing dust from all those yesses before “Page 1, ‘Penelope’” is packed and sent to the Barbican.


If you’ve ever reached the end of James Joyce’s epic book, ‘Ulysses’, you’ll know that it closes with Molly Bloom repeatedly saying the word ‘Yes’ and it is these closing pages that inspired Joe Tilson’s art work. Through the repetition of this word, the concept of time, through the sound of words, is contrasted with a three dimensional object. Indeed, one can’t look at this object without affably muttering, ‘yes, yes, yes…’ 

It got us reflecting in the Digital Curator team about just how well the text of Ulysses lends itself to data visualisation, particularly for scholarly analysis.

A few of our recent favourites:

Visualizing Character Interactions in Ulysses for Bloomsday 2013

Expanding on previous work begun at THATCamp Prime 2012, Ulysses gets the social network visualisation treatment here.

Ulysses

Dislocating Ulysses

A Digital Humanities project to develop “a prototype for mapping readers’ geotemporal experiences of James Joyce’s Ulysses”.

Datatorando

OpenJoyce

Lots of Ulysses visualisation fun to be had on this community led project, including this spiral plot which shows our Molly's abundance of yesses at the end of the novel. 


Spiral_1382454757


 Do you know of interesting Ulysses visualizations? Tweet us on #bldigital. 

-By Nora McGregor, Digital Curator and Jennifer Howes, Curator of Visual Arts


22 October 2013

Digital Conversations Event on Interactive Narratives

The second public event in the British Library Digital Conversations series will take place at 6pm on 4 November 2013 in the British Library staff cafe. This event will focus on the rise of interactive narratives enabled by the digital transformations taking place around us.

It doesn't make much (and the recent record-breaking success of Grand Theft Auto 5 is a case in point here) to realise that videogames and reality television have brought interactive narratives into almost every home and every pocket, onto almost every screen. But what does this mean for the medium libraries hold in the greatest volume - the book? How and to what extent must it adapt to exploit the interactive possibilities of the digital?

Featuring panellists of old and new media alike - our stellar panel include Professor Andrew Burn from the Institute of Education, Professors Gail Marshall and Joanne Shattock from the University of Leicester), the author Iain Pears, and the writer/designer Robert Sherman - this event seeks to address these questions, and more. It will ask how the web is blurring the distinction between authors and readers. It will explore ways in which authors and publishers are using digital narrative to engage with new audiences. And it will consider the case for there being a long history of interactive fiction (think Victorian serial fiction, board games, Choose Your Own Adventure novels, fan fiction...)  and how far that history challenges claims to the novel character of digital interactive narratives.

90551410_a5d4f449f5
Interactivity!

Tickets are free and can be booked through Eventbrite. Places are however limited and there are only a handful left, so if you are unable to get a ticket we'll be recording the whole event, tweeting veracuiously throughout (hashtag #bldigital), sharing the major discussion points here, and publishing the whole thing as a podcast shortly after.


James Baker, Digital Curator

@j_w_baker

07 October 2013

Peeking behind the curtain of the Mechanical Curator

The "Mechanical Curator" is an experiment, providing undirected engagement with the British Library's digital content. Undirected? 
Wordcloud

Random, fortuitous, haphazard, undirected, unplanned, and most importantly, unpredictable. There are already many ways to discover great content that you know you like, but how do you find things that you cannot begin to describe?

The majority of researchers begin their search for content using a general purpose search engine (Ithaka S+R | Jisc | RLUK: UK Survey of Academics 2012 [PDF]). It is easy to forget just how phenomenally powerful these can be, leading researchers to content that they know they want. This is also its shortcoming. The normal mode of searching makes it very difficult to find things that are not known yet. Keyword searches do not make it easy to collide ideas and concepts together, and to view things from different perspectives and to see what might fit together. 

While many of the major providers have made attempts to provide related content to search results, these fall short of being serendipitous. The idea of searching for content fails when the researcher does not even know what they might want to see or how to describe it in words. The Mechanical Curator approaches discovery from the opposite angle, publishing content as it sees fit without an outside agent directing what it should publish.

"I don't know art but I know it when I see it."

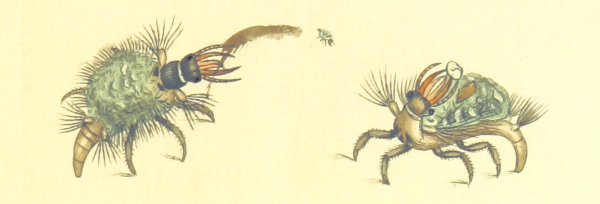
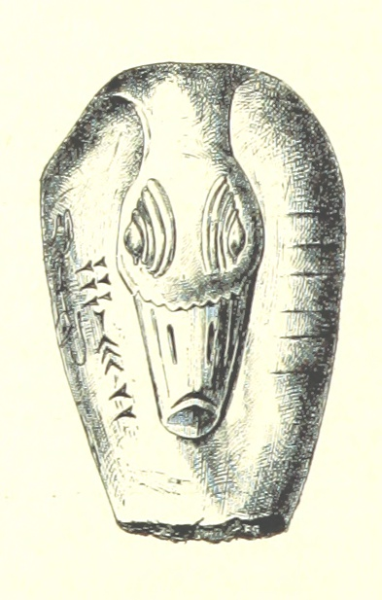
A small book illustration is chosen at random* from the pages of the digitised book collection and posted to a tumblr account with some description information about what book it was taken from, along with its entry in the library catalogue (insofar as this is currently possible.) The images are eclectic and seemingly unthemed, ranging from curious illustrations of animals to ornate, illuminated letters and from drawings of archaeological relics to complex crystal structures.

* - The selection process is not entirely random any more, but more on this development later.
Bugs

Image from ‘The British Miscellany: or, coloured figures of new, rare, or little known animal subjects, etc. vol. I., vol. II’, 003450253 page 275 by SOWERBY, James.

 
Minerals

Image from ‘A System of Mineralogy … Fifth edition, rewritten and enlarged … With three appendixes and corrections. (Appendix I., 1868-1872, by G. J. Brush. Appendix II., 1872-1875, and Appendix III., 1875-1882, by E. S. Dana.)’, 004117752
Relic

Image from ‘The Struggle of the Nations. Egypt, Syria, and Assyria … Edited by A. H. Sayce. Translated by M. L. McClure. With map … and … illustrations’, 002415000 page 696 by MASPERO, Gaston Camille Charles.

The Mechanical Curator. How? Why?

James Baker has written a post illuminating some of the feelings behind the Mechanical Curator so I have constrained myself to write about how I gathered the images from the books, why I did so in the first place, my explorations with the images and why I think it is more interesting that the Mechanical Curator selects images in an almost random fashion, rather than being completely random.

Gathering the images: Context

Microsoft ran a digitisation campaign to provide content for their 'Live Book Search' from around 2005 to 2008. They partnered with a number of libraries and provided the funds and teams to digitise their partner's content.

I have spent some time reorganising and exploring the 65,000 volumes they digitised from the British Library's collection. The years the works cover range from the 14th century right up to the 20th century, with the vast majority being published in the late 19th century. This also means that it has been straightforward to licence these works as being in the public domain, which is why the images are being released with an explicit CC0 licence.

The collection consists of:

  • ~65,000 zipped archives of JPEG2000 image files, with a file per page. Images of the covers and flysheets are also often included,
  • The same number of zipped archives of OCR metadata, encoding the words and letters recognised by the OCR process,
  • Simple METS metadata for the original (physical) item, which was supplied to Microsoft by the British Library,
  • Directories of the unpacked OCR XML and METS metadata, organised by the identifier of the work.

Exploring the pages
Face_detected

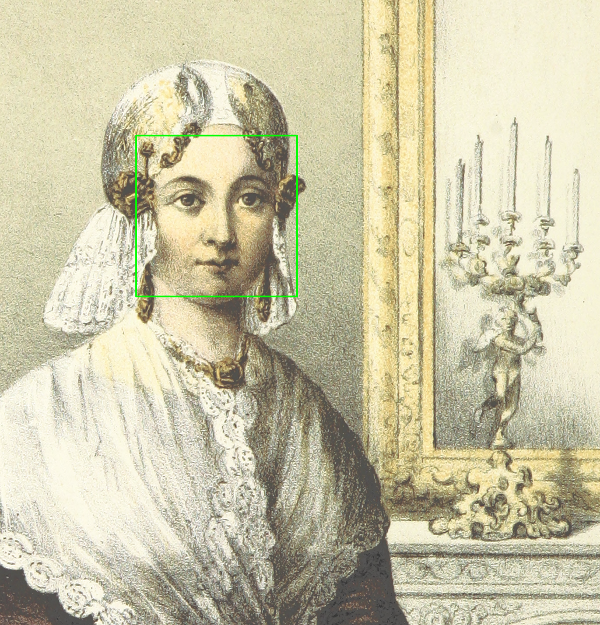
I was interested in mechanical ways of exploring the works - can I reuse existing techniques to detect faces to find out how the depiction of faces changes over time? How to hone in on pages with interesting content like maps, people and diagrams? (given that we cannot tell this from the metadata we have about these works.) 

Most importantly, how can I do this with the limited compute power I have? 

Guideline #1: "Make Effective Filters, and use them early and often"

There are several million pages in this collection, each one potentially containing something of interest. Not all pages will have illustrations on them however and processing them to detect faces would likely be a waste of time and effort. On inspection, the OCR XML occasionally contained information on areas where the OCR software believed it found images:

...
<ComposedBlock ID="P153_CB00001" HPOS="94" VPOS="22" WIDTH="833" HEIGHT="225" STYLEREFS="TXT_0 PAR_LEFT" TYPE="Illustration">
    <GraphicalElement ID="P153_CB00001_SUB" HPOS="94" VPOS="22" WIDTH="833" HEIGHT="225"/>
</ComposedBlock>
...

As we cannot say if the OCR process missed any images, this isn't information enough to guarantee finding all of the illustrations. However, it was enough information to build a list of the 1.1 million pages which might be interesting to scan. So, did I write some code to take the XML, parse it, pull out the right nodes... no. This leads me onto my second guideline:

Guideline #2: "Simple tools are your friends. Learn to love grep, sed, cat, awk and *nix pipes."

In this case, it was clear that the sequence of characters "<GraphicalElement ID=" was going to appear in the XML only to indicate the location of an illustration on a page. Using grep and a little bash scripting, I was able to build a list of OCR XML files which was worth looking at in more detail.

[Example path to the OCR xml for ID: '000000206':  "by_id/0000/000000206/ALTO"' (bold for emphasis.)]

$ for division in `ls by_id`
> do
>   for id in `ls by_id/$division`
>   do
>     grep -l "GraphicalElement" by_id/$division/$id/ALTO/*.xml >> ~/illustrations.txt
>   done
> done

Much of the code above is there to loop through all the XML files I needed to. There are much more concise (but less instructive!) ways to do so, and this way is hopefully clear. The bulk of the work is done by "grep -i" which causes it to print out the names of the files that contain the matching text. The '>>' pipes the output into the 'illustrations.txt' file, appending it to the end of whatever is in there already.

Guideline #3: Break down what you want to do into small sets of simple tasks, rather than trying to do it all at once*.

Instead of trying to create a big application th0at would automatically find, parse and act on the OCR XML in one go, I broke it into separate and straightforward tasks. Tasks like the simple one above that filtered out the OCR XML and created a list of pages that contained illustrations.

* This guideline stems from something I have learned from experience: You should avoid writing 'clever' code unnecessarily. You will revisit old code on occasion and you will be surprised at how quickly you forget all the clever tricks you used! Especially if you have changed programming languages and libraries since then too!

As you perhaps can see from the code, there are small scripts to create a queue of jobs from those pages, and other pieces of code that take those jobs and perform a single task on it. In this case, it was to create a jpeg image from any small (<~8in2) book illustration, as indicated by the OCR XML. The idea was to create a shareable collection of the small images such that they would fit on a USB flash drive. I now have a collection of 394,882 small illustrations, which occupy 41Gb of space. As 64Gb USB drives are not too expensive, I'd argue that I achieved that goal!

It was a straightforward piece of work to write a script that pushed a random image to a tumblr account, with a caption containing the small amount of metadata we had on it. This idea was driven by informal conversations the Digital Scholarship team had about how to make this collection of public domain works more accessible and remixable. The Mechanical Curator was born at that point and has posted a random image to tumblr every hour since that point.

Well, it used to post images it selected on a purely random basis. It used to.

Interests and Mood for the Mechanical Curator

The random images are, by their nature, potentially very interesting and often surfaced some interesting works that would have been otherwise ignored, due to the poor information we had on it, such as a single word title like 'London' or a more mundane description. With the Mechanical Curator, you don't know what is going to be posted next and it became clear that this inherent randomness was intriguing and somewhat addictive.

But what if the Mechanical Curator 'curated' its output in some way? What if it gained a very slight bias in what it posted?

I worked on some code that would allow the curator to assess how similar two images were - not just in terms of the the book's age, author and so on, but how similar the images were visually. This was written using OpenCV, and generates gauges of the content in ways that are described in the code as 'slantyness', 'bubblyness' or simply, size of the image. It adds its judgement to the posted image using tags, saying why it finds the images similar and whether or not it has detected a face or profile within the image and whereabouts it believes it is.

The Mechanical Curator now looks through a number of randomly selected images, and will post an image if it is similar enough to the one it most recently uploaded, both visually and by metadata similarities. However, I didn't want to tip the scales of randomness too much. If it cannot find a match after checking eight images, it gets bored and posts the eighth one as a '#new_train_of_thought'.

Due to its low boredom threshold, it regularly starts a new chain of thought and so doesn't get stuck in a loop of posting floral designs, cartoon line-art images, or of etchings!

03 October 2013

Digital Scholarship training in and outside of the British Library

On September 25th the second semester of our internal Digital Scholarship Training Programme came to an end. Eighteen months in we have delivered 30 one-day courses, 205 individual colleagues from across the British Library have attended, and 641 seats have been filled. More details of are available via the slides for recent presentation on the programme. If you want to know more details of the courses listed on slide 7, contact us at [email protected].

Such has been the success of the programme that we’ve begun to encounter demand from outside of the library to deliver similar courses, collaborate on similar programmes, and to replicate our model. Whilst committed to continuing to deliver courses to colleagues at the library, a gradual opening up of the programme to external audiences is part of our future plans. As they say, watch this space.

The training programme is guided by a number of principles. Primarily we are committed to delivering hands-on introductions to wider concepts in digital scholarship as opposed to training sessions devoted to specific digital research tools. And whilst we imagine this will remain unchanged, we are aware that other principles will be stretched and challenged as we take elements of the programme to external audiences. How, for example, can we ensure that the courses we offer are relevant to individual need when attendees do not have a British Library perspective in common?

Another principle we expect to modify is that training takes place onsite and in a structured manner as opposed to online and in the trainees own time. For although we believe that in many cases the time and space needed for exploration of a concept or idea can only be achieved adequately in a room with other people and a schedule free of meetings, emails and other work-related distractions, training must (and always does) inevitably extend beyond an individual event, beyond a room, beyond a class-based ‘trainer and trainees’ environment.

The final session of our second semester looked at Managing Personal Digital Research Information, contained a significant element of practical use of Zotero, and was led by Sharon Howard from the Humanities Research Institute, University of Sheffield. During the day-long course both Sharon and the course attendees worked through a wiki designed for the event. This wiki provided a framework for the day in question, but can also now work as a learning aid for subsequent individual study by attendees, as an online resource for anyone both in and outside of the library looking to learn more about Zotero, and as a reusable and extensible model for individuals or institutions looking to run similar hands-on events. And hopefully that includes many of you reading this here blog.

A Zotero Guide was created by Sharon Howard as a Zotero resource for a one day training course, Managing Personal Digital Research Information, at the British Library on 25 September 2013. It has been released under a Creative Commons license, so within the terms of the licence feel free to copy material, borrow examples and images and adapt them for your own use.

@j_w_baker

EDITED 03/10/13 15:27 to make it extra clear that at present the programme is available to British Library staff only