A post by Dr Huw Rowlands on his Coleridge Fellowship 2025, 'Cross-cultural Encounters in the Survey of India in the Mid-nineteenth Century'.
To begin at the beginning.
My 2021 doctoral thesis focused on cross-cultural encounters in Aotearoa – New Zealand. I started with an overview of the 18th century voyage of the Endeavour, led by James Cook, to Te Moana nui a Kiwa – the Pacific Ocean. I went on to examine the histories that continue to be created about them in official reports, academic research, museum exhibitions, and documentary film.
Since then, I have been working with the many thousands of maps produced by the Survey of India held in the India Office Records (IOR) Map Collection. I soon became aware of the virtual invisibility of work by the Indian, Burmese and other staff on the maps themselves. With this tucked away at the back of my mind, I have followed my curiosity about digital humanities in British Library and other seminars and workshops, and actively followed the Library’s work on its Race Equality Action Plan. When I came across three series of printed annual reports produced by Survey of India Survey Parties, which listed all survey staff, including those they called ‘Native Surveyors’, these strands quickly came together in my mind and eventually led to my Coleridge Fellowship proposal. The Coleridge Fellowship offers British Library staff the opportunity to pursue a piece of original research and further understanding of the Library’s collections. It was established in 2017 through the generosity of Professor Heather Jackson and her late husband Professor J.R. de J. Jackson, and is named after Samuel Taylor Coleridge (1772-1834).
My aims with the Fellowship are to show the opportunities in the IOR Map Collection to identify a range of individuals involved in mapping what is called in the reports ‘British India’, to learn and demonstrate how data can be extracted and managed, and to reveal its potential in understanding cross-cultural relationships in this context.
Black Boxes
With great support from the Library’s Digital Research and Heritage Made Digital teams among others, particularly Harry Lloyd, Mia Ridge, and Valentina Vavassori, I drew up a plan for the project. The first step was to evaluate the series of reports and choose one set. The next stages are focused on digital methods: firstly to acquire and verify digital images of the chosen reports, use OCR (Optical Character Recognition) to create text files, extract and structure the information I need from them, and lastly visualise the information to create a foundation to help answer my research questions. Each of these stages looked to me like a black box – something clear and present but whose internal workings are a bit of a mystery. At an early planning meeting with the team, we started to explore each black box stage. Black boxes were unpacked onto three white boards: Inputs/Sources, Process, and Results. These initial sketches have become the foundations of my detailed research plan for the digital stages of the project.
One of the whiteboards from our first digital planning meeting
Potentially hidden away in or between each black box were what Mia called ‘magic elves’, imaginary creatures who undertake essential but unresourced tasks such as converting information from one form to another. We unpacked the boxes and set out a series of smaller steps, banishing numerous phantom elves.
My work is currently focused on learning the skills needed to achieve each smaller step. I have been getting to grips with OCR application Transkribus, ably guided by Valentina. Crucial to making the most of such tools is referring forwards to the next digital stage and its own tools, as well as backwards to my research questions. In doing so, the image of a series of discrete black boxes has now given way to a relay race, passing a baton of information on from one stage to the next. The way I use one tool can make the transition onto the next easier or harder. So, while firmly focused on Transkribus, Harry has been guiding me through the stage that follows, so that the data baton can be passed on as smoothly as possible.
Digital image before uploading to Transkribus
As well as relying on some unsophisticated metaphors, my vocabulary has been changing, with both some new words, and some old words with different, or more specific meanings. Regions and tags are two from Transkribus. Regions are a way of segregating areas of the original image so that Transkribus organises the text into separate sections. I have been using the pre-existing Heading and Marginalia, for example, and have added a new Region, Credit, where staff are credited with work undertaken during the year. Using regions should help the data extraction stage by enabling me to focus on areas of text where the data most useful for my research questions is to be found. Tags label individual words or phrases as entities such as People, Places and Organisations. ‘Tag’ is a short word but using tags involves a careful examination of what I need to tag and why, as well as consideration of each tag’s attributes. Transkribus’ default Person tag, for example, includes the Attributes First Name, Last name and dates of Birth and Death. To track promotion over time, I have added a new attribute – Title. Tagging is an intriguing, interpretive process and I expect to have more to say about it later in the project.
Transkribus screenshot showing regions applied to the digital image on the left, and the tagged transcription on the right.
As I move onto the data extraction stage, I will no doubt be acquiring and understanding more vocabulary. I have so far spotted entities, triples, NLP, Python, LLM, and NER, to name a few. I also expect to need a new metaphor or two.
While the British Library works to recover from the October 2023 cyber-attack, we're putting some information from our currently inaccessible website into an easily readable and shareable format. This blog post is based on a page captured by the Wayback Machine in September 2023.
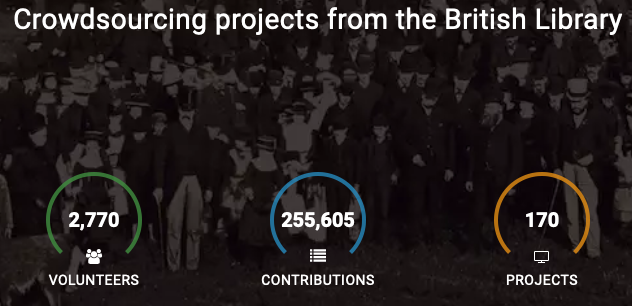
Crowdsourcing at the British Library
Example of a crowdsourcing task
For the British Library, crowdsourcing is an engaging form of online volunteering supported by digital tools that manage tasks such as transcription, classification and geolocation that make our collections more discoverable.
The British Library has run several popular crowdsourcing projects in the past, including the Georeferencer, for geolocating historical maps, and In the Spotlight, for transcribing important information about historical playbills. We also integrated crowdsourcing activities into our flagship AI / data science project, Living with Machines.
Agents of Enslavement uses 18th/19th century newspapers to research slavery in Barbados and create a database of enslaved people.
Living with Machines, which is mostly based on research questions around nineteenth century newspapers
Crowdsourcing Projects at the British Library
Living with Machines (2019-2023) created innovative crowdsourced tasks, including tasks that asked the public to closely read historical newspaper articles to determine how specific words were used.
Agents of Enslavement (2021-2022) used 18th/19th century newspapers to research slavery in Barbados and create a database of enslaved people.
In the Spotlight (2017-2021) was a crowdsourcing project from the British Library that aimed to make digitised historical playbills more discoverable, while also encouraging people to closely engage with this otherwise less accessible collection of ephemera.
Canadian wildlife: notes from the field (2021), a project where volunteers transcribed handwritten field notes that accompany recordings of a wildlife collection within the sound archive.
Convert a Card (2015) was a series of crowdsourcing projects aimed to convert scanned catalogue cards in Asian and African languages into electronic records. The project template can be found and used on GitHub.
Georeferencer (2012 - present) enabled volunteers to create geospatial data from digitised versions of print maps by adding control points to the old and modern maps.
Pin-a-Tale (2012) asked people to map literary texts to British places.
Research Projects
The Living with Machines project included a large component of crowdsourcing research through practice, led by Digital Curator Mia Ridge.
This book is written for crowdsourcing practitioners who work in cultural institutions, as well as those who wish to gain experience with crowdsourcing. It provides both practical tips, grounded in lessons often learned the hard way, and inspiration from research across a range of disciplines. Case studies and perspectives based on our experience are woven throughout the book, complemented by information drawn from research literature and practice within the field.
More Information
Our crowdsourcing projects were designed to produce data that can be used in discovery systems (such as online catalogues and our item viewer) through enjoyable tasks that give volunteers an opportunity to explore digitised collections.
Each project involves teams across the Library to supply digitised images for crowdsourcing and ensure that the results are processed and ingested into various systems. Enhancing metadata through crowdsourcing is considered in the British Library's Collection Metadata Strategy.
We're always pleased to hear that people want to use images from our Flickr collection, and appreciate folk who get in touch to check if their proposed use - particularly commercial use - is ok.
You don't have to credit the Library when using our public domain images, but we always appreciate credit where possible as a way of celebrating their re-use and to help other people find the collection.
If you'd like to credit us, you can say something like 'Images courtesy of the British Library’s Flickr Collection'.
We also love hearing how people have used our images, so please do let us know ([email protected]) about the results if you do use them.
By Digital Curator Mia Ridge for the British Library's Digital Research team
A post by Dr Gethin Rees, Lead Curator, Digital Mapping...
I have recently started a community fellowship working with geographical data from the Sloane Lab project. The project is titled A Generous Approach to Web Mapping Sloane’s Collections and deals with the collection of Hans Sloane, amassed in the eighteenth century and a foundation collection for the British Museum and subsequently the Natural History Museum and the British Library. The aim of the fellowship is to create interactive maps that enable users to view the global breadth of Sloane’s collections, to discover collection items and to click through to their web pages. The Sloane Lab project, funded by the UK’s Arts and Humanities Research Council as part of the Towards a National collection programme, has created the Sloane Lab knowledge base (SLKB), a rich and interconnected knowledge graph of this vast collection. My fellowship seeks to link and visualise digital representations of British Museum and British Library objects in the SLKB and I will be guided by project researchers, Andreas Vlachidis and Daniele Metilli from University College, London.
Figure 1. Bust of Hans Sloane in the British Library.
The first stage of the fellowship is to use data science methods to extract place names from the records of Sloane’s collections that exist in the catalogues today. These records will then be aligned with a gazetteer, a list of places and associated data, such as World Historical Gazetteer (https://whgazetteer.org/). Such alignment results in obtaining coordinates in the form of latitude and longitude. These coordinates mean the places can be displayed on a map, and the fellowship will draw on Peripleo web map software to do this (https://github.com/britishlibrary/peripleo).
Figure 2 Web map using Web Mercator projection, from the Georeferencer.
The fellowship also aims to critically evaluate the use of mapping technologies (eg Google Maps Embed API, MapBoxGL, Leaflet) to present cultural heritage collections on the web. One area that I will examine is the use of the Web Mercator projection as a standard option for presenting humanities data using web maps. A map projection is a method of representing part of the surface of the earth on a plane (flat) surface. The transformation from a sphere or similar to a flat representation always introduces distortion. There are innumerable projections or ways to make this transformation and each is suited to different purposes, with strengths and weaknesses. Web maps are predominantly used for navigation and the Web Mercator projection is well suited to this purpose as it preserves angles.
Figure 3 Map of the world based on Mercator projection including indicatrices to visualise local distortions to area. By Justin Kunimune. Source https://commons.wikimedia.org/wiki/File:Mercator_with_Tissot%27s_Indicatrices_of_Distortion.svg Used under CC-BY-SA-4.0 license.
However, this does not necessarily mean it is the right projection for presenting humanities data. Indeed, it is unsuitable for the aims and scope of Sloane Lab, first, due to well-documented visual compromises —such as the inflation of landmasses like Europe at the expense of, for example, Africa and the Caribbean— that not only hamper visual analysis but also recreate and reinforce global inequities and injustices. Second, the Mercator projection has a history, entangled with processes like colonialism, empire and slavery that also shaped Hans Sloane’s collections. The fellowship therefore examines the use of other projections, such as those that preserve distance and area, to represent contested collections and collecting practices in interactive maps like Leaflet or Open Layers. Geography is intimately connected with identity and thus digital maps offer powerful opportunities for presenting cultural heritage collections. The fellowship examines how reinvention of a commonly used visualisation form can foster thought-provoking engagement with Sloane’s collections and hopefully be applied to visualise the geography of heritage more widely.
Figure 4 Map of the world based on Albers equal-area projection including indicatrices to visualise local distortions to area. By Justin Kunimune. Source https://commons.wikimedia.org/wiki/File:Albers_with_Tissot%27s_Indicatrices_of_Distortion.svg Used under CC-BY-SA-4.0 license.
This is a guest post by Natalie Lucy, a PhD student at University College London, who recently undertook a British Library placement to work on a project Mapping Caribbean Diasporic Networks through the correspondence of Andrew Salkey.
Project Objectives
The project, supervised by curators Eleanor Casson and Stella Wisdom, focussed on the extensive correspondence contained within Andrew Salkey’s archive. One of the initial objectives was to digitally depict the movement of key Caribbean writers and artists, as it is evidenced within the correspondence, many of whom travelled between Britain and the Caribbean as well as the United States, Central and South America and Africa. Although Salkey corresponded with a diverse range of people, we therefore focused on the letters in his archive which were from Caribbean writers and academics and which illustrated patterns of movement of the Caribbean diaspora. Much of the correspondence stems from 1960s and 1970s, a time when Andrew Salkey was particularly active both in the Caribbean Artists Movement and, as a writer and broadcaster, at the BBC.
Photograph of Andrew Salkey
Andrew Salkey was unusual not only for the panoply of writers, artists and politicians with whom he was connected, but that he sustained those relationships, carefully preserving the correspondence which resulted from those networks. My personal interest in this project stemmed from the fact that my PhD seeks to consider the ways that the Caribbean trickster character, Anancy, has historically been reinvented to say something about heritage and identity. Significant to that question was the way that the Caribbean Artists Movement, a dynamic group of artists and writers formed in London in the mid-1960s, and of which Andrew Salkey was a founder, appropriated Anancy, reasserting him and the folktales to convey something of a literary ‘voice’ for the Caribbean. For this reason, I was also interested in the writing networks which were evidenced within the correspondence, together with their impact.
What is Gephi?
Prior to starting the project, Eleanor, who had catalogued the Andrew Salkey archive and Digital Curator, Stella, had identified Gephi as a possible software application through which to visualise this data. Gephi has been used in a variety of projects, including several at Harvard University, examples of the breadth and diversity of those initiatives can be found here. Several of these projects have social networks or historical trading routes as their focus, with obvious parallels to this project. Others notably use correspondence as their main data.
Gathering the Data
Andrew Salkey was known as something of a chronicler. He was interested in letters and travel and was also a serious collector of stamps. As such, he had not only retained the majority of the letters he received but categorised them. Eleanor had originally identified potential correspondents who might be useful to the project, selecting writers who travelled widely, whose correspondence had been separately stored by Salkey, partly because of its volume, and who might be of wider interest to the public. These included the acclaimed Caribbean writers, Samuel Selvon, George Lamming, Jan Carew and Edward Kamau Brathwaite and publishers and political activists, Jessica and Eric Huntley.
Our initial intention was to limit the data to simple facts which could easily be gleaned from the letters. Gephi required that we did so on a spreadsheet ,which had to conform to a particular format. In the first stages of the project, the data was confined to the dates and location of the correspondence, information which could suggest the patterns of movement within the diaspora. However, the letters were so rich in detail, that we ultimately recorded other information. This included any additional travel taken by any of the correspondents, and which was clearly evidenced in the letters, together with any passages from the correspondence which demonstrated either something of the nature and quality of the friendships or, alternatively, the mutual benefit of those relationships to the careers of so many of the writers.
Creating a visual network
Dr Duncan Hay was invited to collaborate with me on this project, as he has considerable expertise in this field, his research interests include web mapping for culture and heritage and data visualisation for literary criticism. After the initial data was collated, we discussed with Duncan what visualisations could be created. It became apparent early on that creating a visualisation of the social networks, as opposed to the patterns of movement, might be relatively straightforward via Gephi, an application which was particularly useful for this type of graph. I had prepared a spreadsheet but, Gephi requires the data to be presented in a strictly consistent way which meant that any anomalies had to be eradicated and the data effectively ‘cleaned up’ using Open Refine. Gephi also requires that information is presented by way of a system of ‘nodes’; ‘edges’ and ‘attributes’ with corresponding spreadsheet columns. In our project, the ‘nodes’ referred to Andrew Salkey and each of the correspondents and other individuals of interest who were specifically referred to within the correspondence. The edges referred to the way that those people were connected which, in this case, was through correspondence. However, what added to the potential of the project was that these nodes and edges could be further described by reference to ‘attributes.’ The possibility of assigning a range of ‘attributes’ to each of the correspondents allowed a wealth of additional information to be provided about the networks. As a consequence, and in order to make any visualisation as informative as possible, I also added brief biographical information for each of the writers and artists to be inputted as ‘attributes’ together with some explanation of the nature of the networks that were being illustrated.
The visual illustration below shows not only the quantity of letters from the sample of correspondents to Andrew Salkey (the pink lines), but also shows which other correspondents formed part of those networks and were referenced as friends or contacts within specific items of correspondence. For example, George Lamming references academic, Rex Nettleford and writer and activist, Claudia Jones, the founder of the Notting Hill Carnival, in his correspondence, connections which are depicted in grey.
Gephi: Andrew Salkey correspondence network
The aim was, however, for the visualisation to also be interactive. This required considerable further manipulation of the format and tools. In this illustration you can see the information that is revealed about the prominent Barbadian writer, George Lamming which, in an interactive format, can be accessed via the ‘i’ symbols beside many of the nodes coloured in green.
Whilst Gephi was a useful tool with which to illustrate the networks, it was less helpful as a way to demonstrate the patterns of movement, one of the primary objectives of the project. A challenge was, therefore, to create a map which could be both interactive and illustrative of the specific locations of the correspondents as well as their movement over time. With Duncan’s input and expertise, we opted for a hybrid approach, utilising two principal ways to illustrate the data: we used Gephi to create a visualisation of the ‘networks’ (above) and another software tool, Kepler.gl, to show the diasporic movement.
A static version of what ultimately will be a ‘moving’ map (illustrating correspondence with reference to person, date and location) is shown below. As well as demonstrating patterns of movement, it should also be possible to access information about specific letters as well as their shelf numbers through this map, hopefully making the archive more accessible.
Patterns of diasporic movement from Andrew Salkey's correspondence, illustrated in Kepler.gl
Whilst we are still exploring the potential of this project and how it might intersect with other areas of research and archives, it has already revealed something of the benefits of this type of data visualisation. For example, a project of this type could be used as an educational tool, providing something of a simple, but dynamic, introduction to the Caribbean Artists Movement. Being able to visualise the project has also allowed us to input information which confirms where specific letters of interest might be found within the archive. Ultimately, it is hoped that the project will offer ways to make a rich, yet arguably undervalued, archive more accessible to a wider audience with the potential to replicate something of an introductory model, or ‘pilot’ for further archives in the future.
Digital Curator Dr Mia Ridge writes, In case you need a break from whatever combination of weather, people and news is around you, here are some ways you can entertain yourself (or the kids!) while helping make collections of the British Library more findable, or help researchers understand our past. You might even learn something or make new discoveries along the way!
Mia Ridge writes: Living with Machines is a collaboration between the British Library and the Alan Turing Institute with partner universities. Help us understand the 'machine age' through the eyes of ordinary people who lived through it. Our refreshed task builds on our previous work, and includes fresh newspaper titles, such as the Cotton Factory Times.
Launched in July this year, Agents of Enslavement? is a research project which explores the ways in which colonial newspapers in the Caribbean facilitated and challenged the practice of slavery. One goal is to create a database of enslaved people identified within these newspapers. This benefits people researching their family history as well as those who simply want to understand more about the lives of enslaved people and their acts of resistance.
Dr. Gethin Rees writes: The community have now georeferenced 93% of 1277 maps that were added from our War Office Archive back in July (as mentioned in our previous newsletter).
Some of the remaining maps are quite tricky to georeference and so if there is a perplexing map that you would like some guidance with do get in contact with myself and our curator for modern mapping by emailing [email protected] and we will try to help. Please do look forward to some exciting news maps being released on the platform in 2022!
Posted by Mahendra Mahey, former Manager of British Library Labs or "BL Labs" for short
[estimated reading time of around 15 minutes]
This is is my last day working as manager of BL Labs, and also my final posting on the Digital Scholarship blog. I thought I would take this chance to reflect on my journey of almost 9 years in helping to set up, maintain and enabling BL Labs to become a permanent fixture at the British Library (BL).
BL Labs was the first digital Lab in a national library, anywhere in the world, that gets people to experiment with its cultural heritage digital collections and data. There are now several Gallery, Library, Archive and Museum Labs or 'GLAM Labs' for short around the world, with an active community which I helped build, from 2018.
I am really proud I was there from the beginning to implement the original proposal which was written by several colleagues, but especially Adam Farquhar, former head of Digital Scholarship at the British Library (BL). The project was at first generously funded by the Andrew W. Mellon foundation through four rounds of funding as well as support from the BL. In April 2021, the project became a permanently funded fixture, helped very much by my new manager Maja Maricevic, Head of Higher Education and Science.
The great news is that BL Labs is going to stay after I have left. The position of leading the Lab will soon be advertised. Hopefully, someone will get a chance to work with my helpful and supportive colleague Technical Lead of Labs, Dr Filipe Bento, bright, talented and very hard working Maja and other great colleagues in Digital Research and wider at the BL.
The beginnings, the BL and me!
I met Adam Farquhar and Aly Conteh (Former Head of Digital Research at the BL) in December 2012. They must have liked something about me because I started working on the project in January 2013, though I officially started in March 2013 to launch BL Labs.
I must admit, I had always felt a bit intimidated by the BL. My first visit was in the early 1980s before the St Pancras site was opened (in 1997) as a Psychology student. I remember coming up from Wolverhampton on the train to get a research paper about "Serotonin Pathways in Rats when sleeping" by Lidov, feeling nervous and excited at the same time. It felt like a place for 'really intelligent educated people' and for those who were one for the intellectual elites in society. It also felt for me a bit like it represented the British empire and its troubled history of colonialism, especially some of the collections which made me feel uncomfortable as to why they were there in the first place.
I remember thinking that the BL probably wasn't a place for some like me, a child of Indian Punjabi immigrants from humble beginnings who came to England in the 1960s. Actually, I felt like an imposter and not worthy of being there.
Nearly 9 years later, I can say I learned to respect and even cherish what was inside it, especially the incredible collections, though I also became more confident about expressing stronger views about the decolonisation of some of these. I became very fond of some of the people who work or use it, there are some really good kind-hearted souls at the BL. However, I never completely lost that 'imposter and being an outsider' feeling.
What I remember at that time, going for my interview, was having this thought, what will happen if I got the position and 'What would be the one thing I would try and change?'. It came easily to me, namely that I would try and get more new people through the doors literally or virtually by connecting them to the BL's collections (especially the digital). New people like me, who may have never set foot, or had been motivated to step into the building before. This has been one of the most important reasons for me to get up in the morning and go to work at BL Labs.
So what have been my highlights? Let's have a very quick pass through!
BL Labs Launch and Advisory Board
I launched BL Labs in March 2013, one week after I had started. It was at the launch event organised by my wonderfully supportive and innovative colleague, Digital Curator Stella Wisdom. I distinctly remember in the afternoon session (which I did alone), I had to present my 'ideas' of how I might launch the first BL Labs competition where we would be trying to get pioneering researchers to work with the BL's digital collections.
God it was a tough crowd! They asked pretty difficult questions, questions I myself was asking too which I still didn't know the answer too either.
My first gut feeling overall after the event was, this is going to be hard work. This feeling and reality remained a constant throughout my time at BL Labs.
In early May 2013, we launched the competition, which was a really quick and stressful turnaround as I had only officially started in mid March (one and a half months). I remember worrying as to whether anyone would even enter! All the final entries were pretty much submitted a few minutes before the deadline. I remember being alone that evening on deadline day near to midnight waiting by my laptop, thinking what happens if no one enters, it's going to be disaster and I will lose my job. Luckily that didn't happen, in the end, we received 26 entries.
I am a firm believer that we can help make our own luck, but sometimes luck can be quite random! Perhaps BL Labs had a bit of both!
After that, I never really looked back! BL Labs developed its own kind of pattern and momentum each year:
hunting around the BL for digital collections to make into datasets and make available
helping to make more digital collections openly licensed
having hundreds of conversations with people interested in connecting with the BL's digital collections in the BL and outside
working with some people more intensively to carry out experiments
developing ideas further into prototype projects
telling the world of successes and failures in person, meetings, events and social media
launching a competition and awards in April or May
roadshows before and after with invitations to speak at events around the world
the summer working with competition winners
late October/November the international symposium showcased things from the year
'Nothing interesting happens in the office' - Roadshows, Presentations, Workshops and Symposia!
One of the highlights of BL Labs was to go out to universities and other places to explain what the BL is and what BL Labs does. This ended up with me pretty much seeing the world (North America, Europe, Asia, Australia, and giving virtual talks in South America and Africa).
My greatest challenge in BL Labs was always to get people to truly and passionately 'connect' with the BL's digital collections and data in order to come up with cool ideas of what to actually do with them. What I learned from my very first trip was that telling people what you have is great, they definitely need to know what you have! However, once you do that, the hard work really begins as you often need to guide and inspire many of them, help and support them to use the collections creatively and meaningfully. It was also important to understand the back story of the digital collection and learn about the institutional culture of the BL if people also wanted to work with BL colleagues. For me and the researchers involved, inspirational engagement with digital collections required a lot of intellectual effort and emotional intelligence. Often this means asking the uncomfortable questions about research such as 'Why are we doing this?', 'What is the benefit to society in doing this?', 'Who cares?', 'How can computation help?' and 'Why is it necessary to even use computation?'.
Making those connections between people and data does feel like magic when it really works. It's incredibly exciting, suddenly everyone has goose bumps and is energised. This feeling, I will take away with me, it's the essence of my work at BL Labs!
A full list of over 200 presentations, roadshows, events and 9 annual symposia can be found here.
Competitions, Awards and Projects
Another significant way BL Labs has tried to connect people with data has been through Competitions (tell us what you would like to do, and we will choose an idea and work collaboratively with you on it to make it a reality), Awards (show us what you have already done) and Projects (collaborative working).
At the last count, we have supported and / or highlighted over 450 projects in research, artistic, entrepreneurial, educational, community based, activist and public categories most through competitions, awards and project collaborations.
We also set up awards for British Library Staff which has been a wonderful way to highlight the fantastic work our staff do with digital collections and give them the recognition they deserve. I have noticed over the years that the number of staff who have been working on digital projects has increased significantly. Sometimes this was with the help of BL Labs but often because of the significant Digital Scholarship Training Programme, run by my Digital Curator colleagues in Digital Research for staff to understand that the BL isn't just about physical things but digital items too.
Browse through our project archive to get inspiration of the various projects BL Labs has been involved in or highlighted.
Putting the digital collections 'where the light is' - British Library platforms and others
When I started at BL Labs it was clear that we needed to make a fundamental decision about how we saw digital collections. Quite early on, we decided we should treat collections as data to harness the power of computational tools to work with each collection, especially for research purposes. Each collection should have a unique Digital Object Identifier (DOI) so researchers can cite them in publications. Any new datasets generated from them will also have DOIs, allowing us to understand the ecosystem through DOIs of what happens to data when you get it out there for people to use.
However, BL Labs has not stopped there! We always believed that it's important to put our digital collections where others are likely to discover them (we can't assume that researchers will want to come to BL platforms), 'where the light is' so to speak. We were very open and able to put them on other platforms such as Flickr and Wikimedia Commons, not forgetting that we still needed to do the hard work to connect data to people after they have discovered them, if they needed that support.
Our greatest success by far was placing 1 million largely undescribed images that were digitally snipped from 65,000 digitised public domain books from the 19th Century on Flickr Commons in 2013. The number of images on the platform have grown since then by another 50 to 60 thousand from collections elsewhere in the BL. There has been significant interaction from the public to generate crowdsourced tags to help to make it easier to find the specific images. The number of views we have had have reached over a staggering 2 billion over this time. There have also been an incredible array of projects which have used the images, from artistic use to using machine learning and artificial intelligence to identify them. It's my favourite collection, probably because there are no restrictions in using it.
Read the most popular blog post the BL has ever published by my former BL Labs colleague, the brilliant and inspirational Ben O'Steen, a million first steps and the 'Mechanical Curator' which describes how we told the world why and how we had put 1 million images online for anyone to use freely.
It is wonderful to know that George Oates, the founder of Flickr Commons and still a BL Labs Advisory Board member, has been involved in the creation of the Flickr Foundation which was announced a few days ago! Long live Flickr Commons! We loved it because it also offered a computational way to access the collections, critical for powerful and efficient computational experiments, through its Application Programming Interface (API).
I loved working with artists, its my passion! They are so creative and often not restricted by academic thinking, see the work of Mario Klingemann for example! You can browse through our archives for various artistic projects that used the BL's digital collections, it's inspiring.
I was also involved in the first British Library Fashion Student Competition won by Alanna Hilton, held at the BL which used the BL's Flickr Commons collection as inspiration for the students to design new fashion ranges. It was organised by my colleague Maja Maricevic, the British Fashion Colleges Council and Teatum Jones who were great fun to work with. I am really pleased to say that Maja has gone on from strength to strength working with the fashion industry and continues to run the competition to this day.
I am really proud of helping to create the international GLAM Labs community with over 250 members, established in 2018 and still active today. I affectionately call them the GLAM Labbers, and I often ask people to explore their inner 'Labber' when I give presentations. What is a Labber? It's the experimental and playful part of us we all had as children and unfortunately many have lost when becoming an adult. It's the ability to be fearless, having the audacity and perhaps even naivety to try crazy things even if they are likely to fail! Unfortunately society values success more than it does failure. In my opinion, we need to recognise, respect and revere those that have the courage to try but failed. That courage to experiment should be honoured and embraced and should become the bedrock of our educational systems from the very outset.
Two years ago, many of us Labbers 'ate our own dog food' or 'practised what we preached' when me and 15 other colleagues came together for 5 days to produce a book through a booksprint, probably the most rewarding professional experience of my life. The book is about how to set up, maintain, sustain and even close a GLAM Lab and is called 'Open a GLAM Lab'. It is available as public domain content and I encourage you to read it.
Online drop-in goodbye - today!
I organised a 30 minute ‘online farewell drop-in’ on Wednesday 29 September 2021, 1330 BST (London), 1430 (Paris, Amsterdam), 2200 (Adelaide), 0830 (New York) on my very last day at the British Library. It was heart-warming that the session was 'maxed out' at one point with participants from all over the world. I honestly didn't expect over 100 colleagues to show up. I guess when you leave an organisation you get to find out who you actually made an impact on, who shows up, and who tells you, otherwise you may never know.
Those that know me well know that I would have much rather had a farewell do ‘in person’, over a pint and praying for the ‘chip god’ to deliver a huge portion of chips with salt/vinegar and tomato sauce’ magically and mysteriously to the table. The pub would have been Mc'Glynns (http://www.mcglynnsfreehouse.com/) near the British Library in London. I wonder who the chip god was? I never found out ;)
The answer to who the chip god was is in text following this sentence on white on white text...you will be very shocked to know who it was!- s
Spoiler alert it was me after all, my alter ego
Mahendra's online farewell to BL Labs, Wednesday 29 September, 1330 BST, 2021. Left: Flowers and wine from the GLAM Labbers arrived in Tallinn, 20 mins before the meeting! Right: Some of the participants of the online farewell
Leave a message of good will to see me off on my voyage!
It would be wonderful if you would like to leave me your good wishes, comments, memories, thoughts, scans of handwritten messages, pictures, photographs etc. on the following Google doc:
I will leave it open for a week or so after I have left. Reading positive sincere heartfelt messages from colleagues and collaborators over the years have already lifted my spirits. For me it provides evidence that you perhaps did actually make a difference to somone's life. I will definitely be re-reading them during the cold dark Baltic nights in Tallinn.
I would love to hear from you and find out what you are doing, or if you prefer, you can email me, the details are at the end of this post.
BL Labs Sailor and Captain Signing Off!
It's been a blast and lots of fun! Of course there is a tinge of sadness in leaving! For me, it's also been intellectually and emotionally challenging as well as exhausting, with many ‘highs’ and a few ‘lows’ or choppy waters, some professional and others personal.
I have learned so much about myself and there are so many things I am really really proud of. There are other things of course I wish I had done better. Most of all, I learned to embrace failure, my best teacher!
I think I did meet my original wish of wanting to help to open up the BL to as many new people who perhaps would have never engaged in the Library before. That was either by using digital collections and data for cool projects and/or simply walking through the doors of the BL in London or Boston Spa and having a look around and being inspired to do something because of it.
I wish the person who takes over my position lots of success! My only piece of advice is if you care, you will be fine!
Anyhow, what a time this has been for us all on this planet? I have definitely struggled at times. I, like many others, have lost loved ones and thought deeply about life and it's true meaning. I have also managed to find the courage to know what’s important and act accordingly, even if that has been a bit terrifying and difficult at times. Leaving the BL for example was not an easy decision for me, and I wish perhaps things had turned out differently, but I know I am doing the right thing for me, my future and my loved ones.
Though there have been a few dark times for me both professionally and personally, I hope you will be happy to know that I have also found peace and happiness too. I am in a really good place.
I would like to thank former alumni of BL Labs, Ben O'Steen - Technical Lead for BL Labs from 2013 to 2018, Hana Lewis (2016 - 2018) and Eleanor Cooper (2018-2019) both BL Labs Project Officers and many other people I worked through BL Labs and wider in the Library and outside it in my journey.
Where I am off to and what am I doing?
My professional plans are 'evolving', but one thing is certain, I will be moving country!
To Estonia to be precise!
I plan to live, settle down with my family and work there. I was never a fan of Brexit, and this way I get to stay a European.
I would like to finish with this final sweet video created by writer and filmaker Ling Low and her team in 2016, entitled 'Hey there Young Sailor' which they all made as volunteers for the Malaysian band, the 'Impatient Sisters'. It won the BL Labs Artistic Award in 2016. I had the pleasure and honour of meeting Ling over a lovely lunch in Kuala Lumpa, Malaysia, where I had also given a talk at the National Library about my work and looked for remanants of my grandfather who had settled there many years ago.
I wish all of you well, and if you are interested in keeping in touch with me, working with me or just saying hello, you can contact me via my personal email address: [email protected] or follow my progress on my personal website.
Happy journeys through this short life to all of you!
In this post, Dr Mia Ridge and others celebrate our award-winning contributors and share progress reports from a range of crowdsourcing projects at the British Library.
Despite significant challenges, 2020 was a year of remarkable achievements for crowdsourcing at the British Library. Read on for some highlights.
A quarter of a million contributions on LibCrowds
The LibCrowds platform, which hosts our In the Spotlight project and previously hosted Convert-a-Card, reached an incredible milestone in mid-December - a quarter of a million contributions! Our heartfelt thanks to the nearly 3000 registered volunteers, and countless anonymous others who contributed to this fantastic achievement via our projects.
The official launch - and completion! - of crowdsourcing tasks on Living with Machines
Building on the lessons learnt from earlier experiments, in early December we launched two new crowdsourcing projects with data scientists from the Living with Machines project. These projects aimed to integrate linguistic research questions with tasks that encouraged volunteers to engage with social and technological history in the pages of 19th century newspapers. We learnt a lot and tweaked the project after the feedback from Zooniverse volunteers, and were delighted to be recognised as an official Zooniverse project.
Thanks to the mighty power of Zooniverse volunteers, the tasks were completed within a few days. Analysing the results will keep us busy in the first few months of 2021.
In the Spotlight and Georeferencer contributors are award-winning!
Earlier this year, digital volunteers on the British Library's In the Spotlight and Georeferencer projects were nominated in the Community category of the British Library Labs awards. You can watch the 30 second videos about the nominations for In the Spotlight and Georeferencer on YouTube. Awards winners are decided by BL Labs and other Library staff with the BL Labs Advisory Board, and we're delighted to say that both projects won with a joint award for first place!
Congratulations to all our contributors for this recognition of your work with our crowdsourcing tasks, and for discussing our collections and sharing your insights with us and others.
In the Spotlight
In addition to the 255,000+ contributions above, volunteers have completed tasks on 148 volumes of historical playbills. We continue to work with our Metadata Services team to integrate these transcriptions into British Library systems. The project has a remarkable international reach, with visitors to the project from 1736 cities in 104 countries. Whether you're from Accra, Hanoi, London, Moscow, San Antonio or Zagreb - thank you!
Georeferencer
Dr Gethin Rees, Lead Curator for Digital Map Collections, writes:
In 2014 the British Library released over 50,000 images of maps onto the Georeferencer that had been extracted from the millions of Flickr images from 17th-, 18th- and 19th-century books with the help of volunteers. Ever since then the volunteers have been hard at work adding coordinate data on the Georeferencer platform and I am delighted to announce that the collection has now been effectively completed. The upgraded Georeferencer and the time we have all had to spend indoors over the last months appear to have provided the project with a new impetus, well done to all!
The work of Georeferencer volunteers on this Flickr collection of maps has been invaluable to the Library; the addition of coordinate data from the Flickr collection to the British Library's Aleph catalogue has offered a new metadata perspective for our collections. The Flickr maps can be browsed using an interactive web map allowing the public to easily discover maps of areas where they live or are interested in. We are intending on making the georeferenced maps available as GeoTIFFs on the British Library's Research Repository. A huge thank you to maurice, Janet H, Nigel Slack, Martin Whitton, Benjamin G, John Herridge, Singout, H Barber, Jheald and Michael Ammon and all the Georeferencer community for their amazing work on the platform and feedback over the years.
Following the completion of the Flickr work, we released just under 8000 images from the K. Top collection onto the BL's Georeferencer. The maps are part of a larger collection of 18,000 digital images of historic maps, views and texts from the Topographical Collection of King George III that have been released into the public domain. The collection has been digitised as part of a seven-year project to catalogue, conserve and digitise the collection which was presented to the Nation in 1823 by King George IV. The images are made available on the image sharing site Flickr, which links to fully searchable catalogue records on Explore the British Library. The Georeferencers have been making short work of these maps: they were added back in early October and 54% have already been completed. This initial 8000 is the first of two planned Georeferencer releases.
Dr Graham Jevon, Cataloguer, Endangered Archives Programme, writes:
EAP's Siberian photographs project is close to moving to the next phase. Thanks to the amazing work of all our contributors, one task has been completed and the second task is almost complete.
In 2021, we are looking forward to processing the results in order to enhance the online catalogue and also to begin an exciting new research project based on the tags you have created - we hope to be able to share more news on this in the coming months!
Meanwhile, Russian curators Katya Rogatchevskaia and Katie McElvanney have been working hard behind the scenes on this project. One of the fruits of this work has been the translation of the Zooniverse platform terms into Russian. This will help enable any future crowdsourcing projects to publish their projects on Zooniverse in Russian as well as English.
Nominate a case study for the 'Collective Wisdom' project
This AHRC-funded project led by Dr Mia Ridge aims to foster an international community of practice and set a research agenda for crowdsourcing in cultural heritage. In March 20201 we'll collaboratively write a book on the state of the art in crowdsourcing in cultural heritage through two intensive week-long 'book sprint' sessions. We'd like to include case studies from a range of projects that include crowdsourcing, online volunteering or digital participation - please get in touch if you'd like to find out more or would like to suggest a project for inclusion.