Digital scholarship blog

Enabling innovative research with British Library digital collections

18 posts categorized "West Africa"

06 September 2018

Visualising the Endangered Archives Programme project data on Africa, Part 3. Finishing up

Sarah FitzGerald is a linguistics PhD researcher at the University of Sussex investigating the origins and development of Cameroon Pidgin English. She is currently a research placement student in the British Library’s Digital Scholarship Team, using data from the Endangered Archives Programme to create data visualisations

This summer I have taken a break by working hard, I’ve broadened my academic horizons by ignoring academia completely, and I’ve felt at home while travelling hundreds of miles a week. But above all else, I’ve just had a really nice time.

In my last two blogs I covered the early stages of my placement at the British Library, and discussed the data visualisation tools I’ve been exploring.

In this final blog I am going to outline the later stages of my project, I am also going to talk about my experience of undertaking a British Library placement, what I’ve learned and whether it was worth it (spoiler alert, it was).

What I’ve been doing

The final stages of my project have mostly consisted of two separate lines of investigation.

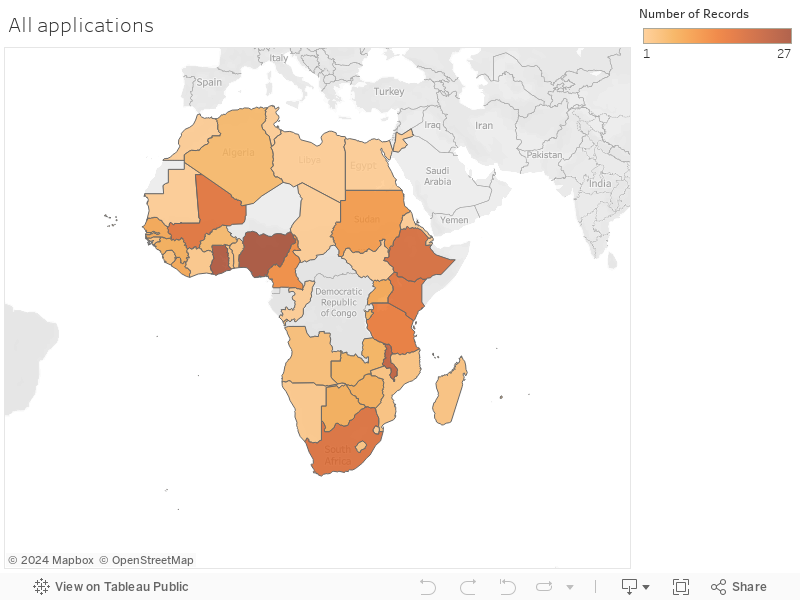
Firstly, I have been working on finding out as much as I can about the  Endangered Archives Programme (EAP)’s projects in Africa and finding the best ways to visualise that information in order to create a sort of bank of visualisations that the EAP team can use when they are talking about the work that they do. Visualisations, such as the one below showing the number of applications related to each region of Africa by year, can make tables of data much easier to understand.

a line graph showing Endangered Archives applications by region year on year.

Secondly, I was curious about why some project applications get funded and some do not. I wanted to know if I could identify any patterns in the reasons why projects get rejected.

This gave me the opportunity to apply my skills as a linguist to the data, albeit on a small scale. I decided to examine the feedback given to unsuccessful applicants by the panel that awards the EAP grants to see if I could identify any patterns. To do this I created a corpus, or electronic database, of texts. This could then be run through corpus analysis software to look for patterns.

screenshot showing a window of AntConc corpus analysis software listing word tokens along with their frequency and rank

This image shows a word list created for my corpus using AntConc software, which is a free and open source corpus analysis tool.

My analysis allowed me to identify a number of issues common to many unsuccessful applications. In addition to applications outside of the scope of EAP there are also proposals which would make excellent projects but their applications lack the necessary information to award a grant.

Based on my analysis I was able to make a number of recommendations about additional information EAP could provide for applicants which might help to prevent potentially valuable archives being lost due to poor applications.

What I’ve learned

As well as learning about visualisation software I’ve learned a lot this summer about the EAP archives.

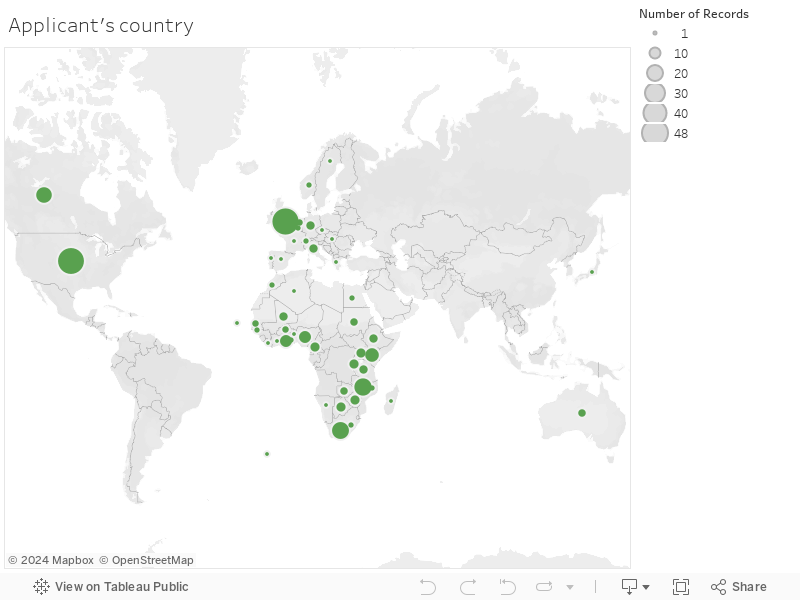
I’ve found out where applications are coming from, and which African countries have the most associated applications. I’ve learned that there are many great data visualisation tools available for free online. I’ve learned that there are over 70 different languages represented in the EAP archived projects from Africa.

black and white photo of James Ssali and and unknown woman dressed smartly and standing arm-in-arm before the camera
James Ssali and an unknown woman, from the Ham Musaka archive, Uganda (EAP656)

One of the most interesting things I’ve learned is just how much archival material is available for research – and on an incredibly broad range of topics. The materials digitised and preserved in Africa over the last 13 years includes:

This wealth of information provides so much opportunity for research and these are just the archives from Africa. The EAP funds projects all over the world.

colour photograph of two pages from the opened Shui manuscript.
Shui manuscript from China (EAP143)

In addition to learning about the EAP archives I’ve learned a lot from working in the British Library more generally. The scale of the work that is carried out is immense and I don’t think I fully appreciated before working here for three months just how large the challenges they face are.

In addition to preserving a copy of every book published in the UK, the BL is also working to create large digital archives in order to facilitate the way that modern scholarship has developed. They are digitising books, audio, websites, as well as historical documents such as the records of the East India Company.

Colour photograph of East India House and the street outside bustling with pedestrians and horse and cart traffic
View of East India House by Thomas Hosmer Shepherd

Was it worth it?

A PhD is an intense thing to undertake and you have a time limit to complete it. At first glance, taking three months out to work on a placement with little direct relevance to my PhD might seem a bit foolish, particularly when it means a daily commute from Brighton to London.

Far from wasting my time, however, this placement has been an enriching experience. My PhD is on the origins and development of Cameroon Pidgin English. This placement has given me a break from my work while broadening my understanding of African culture and the context in which the language I study is spoken.

I’ve always had an interest in data visualisation and my placement has given me time to play with visualisation tools and gain a real understanding of the resources available. I feel refreshed and ready for the new term despite having worked full time all summer.

The break has also given me thinking space, it has allowed ideas to percolate and given me new skills which I can apply to my work. Taking a break from academia has given me more perspective on my work and more options for how to develop it.

colour photograph of the bronze statue of Isaac Newton outside the British Library site in London
The British Library, St Pancras

Finally, the travel has been a lot but my supervisors have been very flexible, allowing me to work from home two days a week. The up-side of coming to London regularly has been getting to work with interesting people.

Working in a large institution could be an intimidating and isolating experience but it has been anything but. The digital scholarship team have been welcoming and interested, in particular I have had two very supportive supervisors. The British Library are really keen to support and develop placement students, and there is a lovely community of PhD students at the BL some on placements, some doing their PhD here.

I have had a great time at the British Library this summer and can only recommend the scheme to anyone thinking of applying for a placement next year.

08 August 2018

Visualising the Endangered Archives Programme project data on Africa, Part 2. Data visualisation tools

Sarah FitzGerald is a linguistics PhD researcher at the University of Sussex investigating the origins and development of Cameroon Pidgin English. She is currently a research placement student in the British Library’s Digital Scholarship Team, using data from the Endangered Archives Programme to create data visualisations

When I wrote last week that the Endangered Archives Programme (EAP) receive the most applications for archives in Nigeria, Ghana and Malawi, I am reasonably sure you were able to digest that news without difficulty.

Is that still the case if I add that Ethiopia, South Africa and Mali come in fourth, fifth and sixth place; and that the countries for which only a single application has been received include Morocco, Libya, Mauritania, Chad, Eritrea, and Egypt?

What if I give you the same information via a handy interactive map?

This map, designed using Tableau Public, shows the location of every archive that the EAP received between 2004 and 2017. Once you know that the darker the colour the more applications received, you can see at a glance how the applications have been distributed. If you want more information you can hover your cursor over each country to see its name and number of associated applications.

My placement at the British Library centres on using data visualisations such as this to tell the story of the EAP projects in Africa.

EAP054
Photo from a Cameroonian photographic archive (EAP054)

When not undertaking a placement I am a linguist. This doesn’t require a lot of data visualisation beyond the tools available in Excel. In my previous blog I discussed how useful Excel tools have been for giving me an overview of the EAP data. But there are some visualisations you can’t create in Excel, such as an interactive heat map, so I had to explore what other tools are available.

Inspired by this excellent blog from a previous placement student I started out by investigating Tableau Public primarily to look for ways to represent data using a map.

Tableau Public is open source and freely available online. It is fairly intuitive to use and has a wide range of possible graphs and charts, not just maps. You upload a spreadsheet and it will tell you how to do the rest. There are also many instructional videos online that show you the range of possibilities available.

As well as the heat map above, I also used this tool to examine which countries applications are coming from.

This map shows that the largest number of applications have come from the USA and UK, but people from Canada, South Africa and Malawi have also applied for a lot of grants.

Malawi has a strong showing on both maps. There have been 23 applications to preserve archives in Malawi, and 21 applicants from within Malawi.

EAP942
Paper from the Malawi news archive (EAP942)

Are these the same applications?

My spreadsheet suggests that they are. I can also see that there seems to be links between certain countries, such as Canada and Ethiopia, but in order to properly understand these connections I need a tool that can represent networks – something Tableau Public cannot do.

After some investigation (read ‘googling’) I was able to find Gephi, free, open source software designed specifically for visualising networks.

Of all the software I have used in this project so far, Gephi is the least intuitive. But it can be used to create informative visualisations so it is worth the effort to learn. Gephi do provide a step by step guide to getting started, but the first step is to upload a spreadsheet detailing your ‘nodes’ and ‘edges’.

Having no idea what either of these were I stalled at step one.  

Further googling turned up this useful blog post written for complete beginners which informed me that nodes are individual members of a network. So in my case countries. My list of nodes includes both the country of the archive and the country of the applicant. Edges are the links between nodes. So each application creates a link, or edge, between the two countries, or nodes, involved.

Once I understood the jargon, I was able to use Gephi’s guide to create the network below which shows all applications between 2004 and 2017 regardless of whether they were successful in acquiring a grant. Gephi GraphIn this visualisation the size of each country relates to the number of applications it features in, as country of archive, country of applicant, or both.  The colours show related groups.

Each line shows the direction and frequency of application. The line always travels in a clockwise direction from country of applicant to country of archive, the thicker the line the more applications. Where the country of applicant and country of archive are the same the line becomes a loop.

I love network maps because you can learn so much from them. In this one, for example, you can see (among other things):

  • strong links between the USA and West Africa
  • multiple Canadian applications for Sierra Leonean and Ethiopian archives
  • UK applications to a diverse range of countries
  • links between Egypt and Algeria and between Tunisia and Morocco

The last tool I explored was Google Fusion Tables. These can be used to present information from a spreadsheet on a map. Once you have coordinates for your locations, Fusion Tables are incredibly easy to use (and will fill in coordinates for you in many cases).  You upload the spreadsheet, pick the information to include and it’s done. It is so intuitive that I have yet to do much reading on how it works – hence the lack of decision on how to use it.

There is currently a Fusion-based Table over on the EAP website with links to every project they have funded. It is possible to include all sorts of information for each archive location so I plan create something more in depth for the African archives that can potentially be used as a tool by researchers.

The next step for my project is to apply these tools to the data in order to create a range of visualisations which will be the stars of my third and final blog at the beginning of September, so watch this space.

01 August 2018

Visualising the Endangered Archives Programme project data on Africa, Part 1. The project

Sarah FitzGerald is a linguistics PhD researcher at the University of Sussex investigating the origins and development of Cameroon Pidgin English. She is currently a research placement student in the British Library’s Digital Scholarship Team, using data from the Endangered Archives Programme to create data visualisations.

This month I have learned:

  • that people in Canada are most likely to apply for grants to preserve archives in Ethiopia and Sierra Leone, whereas those in the USA are more interested in endangered archives in Nigeria and Ghana
  • that people in Africa who want to preserve an archive are more likely to run a pilot project before applying for a big grant whereas people from Europe and North America go big or go home (so to speak)
  • that the African countries in which endangered archives are most often identified are Nigeria, Ghana and Malawi
  • and that Eastern and Western African countries are more likely to be studied by academics in Europe and North America than those of Northern, Central or Southern Africa
EAP051
Idrissou Njoya and Nji Mapon examine Mapon's endangered manuscript collection in Cameroon (EAP051)

I have learned all of this, and more, from sifting through 14 years of the Endangered Archive Programme’s grant application data for Africa.

Why am I sifting through this data?

Well, I am currently half way through a three-month placement at the British Library working with the Digital Scholarship team on data from the Endangered Archives Programme (EAP). This is a programme which gives grants to people who want to preserve and digitise pre-modern archives under threat anywhere in the world.

EAP466
Manuscript of the Riyadh Mosque of Lamu, Kenya (EAP466)

The focus of my placement is to look at how the project has worked in the specific case of Africa over the 14 years the programme has been running. I’ll be using this data to create visualisations that will help provide information for anyone interested in the archives, and for the EAP team.

Over the next weeks I will be writing a series of blog posts detailing my work. This first post gives an overview of the project and its initial stages. My second post will discuss the types of data visualisation software I have been learning to use. Then, at the end of my project, I will be writing a post about my findings, using the visualisations.

The EAP has funded the preservation of a range of important archives in Africa over the last decade and a half. Some interesting examples include a project to preserve botanical collections in Kenya, and one which created a digital record of endangered rock inscriptions in Libya. However, my project is more concerned with the metadata surrounding these projects – who is applying, from where, and for what type of archive etc.

EAP265
Tifinagh rock inscriptions in the Tadrart Acacus mountains, Libya (EAP265)

I’m also concerned with finding the most useful ways to visualise this information.

For 14 years the details of each application have been recorded in MS Excel spreadsheets. Over time this system has evolved, so my first step was to fill in information gaps in the spreadsheets. This was a time-consuming task as gap filling had to be done manually by combing through individual application forms looking for the missing information.

Once I had a complete data set, I was able to a free and open source software called OpenRefine to clean up the spreadsheet.  OpenRefine can be used to edit and regularise spreadsheet data such as spelling or formatting inconsistencies quickly and thoroughly. There is an excellent article available here if you are interested in learning more about how to use OpenRefine and what you can do with it.

With a clean, complete, spreadsheet I could start looking at what the data could tell me about the EAP projects in Africa.

I used Excel visualisation tools to give me an overview of the information in the spreadsheet. I am very familiar with Excel, so this allowed me to explore lots of questions relatively quickly.

Major vs Pilot Chart

For example, there are two types of projects that EAP fund. Small scale, exploratory, pilot studies and larger scale main projects. I wondered which type of application was more likely to be successful in being awarded a grant. Using Excel it was easy to create the charts above which show that major projects are actually more likely to be funded than pilots are.

Of course, the question of why this might be still remains, but knowing this is the pattern is a useful first step for investigation.

Another chart that was quick to make shows the number of applicants from each continent by year.

Continent of Applicant Chart

This chart reveals that, with the exception of the first three years of the programme, most applications to preserve African archives have come from people living in Africa. Applications from North America and Europe on average seem to be pretty equal. Applications from elsewhere are almost non-existent, there have been three applications from Oceania, and one from Asia over the 14 years the EAP has been running.

This type of visualisation gives an overview at a glance in a way that a table cannot. But there are some things Excel tools can’t do.

I want to see if there are links between applicants from specific North American or European countries and archives in particular African countries, but Excel tools are not designed to map networks. Nor can Excel be used to present data on a map, which is something that the EAP team is particularly keen to see, so my next step is to explore the free software available which can do this.

This next stage of my project, in which I explore a range of data visualisation tools, will be detailed in a second blog post coming soon.

03 November 2016

Black Abolitionist Performances and their Presence in Britain - An update!

Posted by Hannah-Rose Murray, finalist in the BL Labs Competition 2016.

Reflecting back on an incredible and interesting journey over the last few months, it is remarkable at the speed in which five months has flown by! In May, I was chosen as one of the finalists for the British Library Labs Competition 2016, and my project has focused on black abolitionist performances and their presence in Britain during the nineteenth century. Black men and women had an impact in nearly every part of Great Britain, and it is of no surprise to learn their lectures were held in famous meeting halls, taverns, the houses of wealthy patrons, theatres, and churches across the country: we inevitably and unknowably walk past sites with a rich history of Black Britain every day.

I was inspired to apply for this competition by last year’s winner, Katrina Navickas. Her project focused on the Chartist movement, and in particular using the nineteenth century digitised newspaper database to find locations of Chartist meetings around the country. Katrina and the Labs team wrote code to identify these meetings in the Chartist newspaper, and churned out hundreds of results that would have taken her years to search manually.

I wanted to do the same thing, but with black abolitionist speeches. However, there was an inherent problem: these abolitionists travelled to Britain between 1830-1900 and gave lectures in large cities and small towns: in other words their lectures were covered in numerous city and provincial newspapers. The scale of the project was perhaps one of the most difficult things we have had to deal with.

When searching the newspapers, one of the first things we found was the OCR (Optical Character Recognition) is patchy at best. OCR refers to scanned images that have been turned into machine-readable text, and the quality of the OCR depended on many factors – from the quality of the scan itself, to the quality of the paper the newspaper was printed on, to whether it has been damaged or ‘muddied.’ If the OCR is unintelligible, the data will not be ‘read’ properly – hence there could be hundreds of references to Frederick Douglass that are not accessible or ‘readable’ to us through an electronic search (see the image below).

American-slavery
An excerpt from a newspaper article about a public meeting about slavery, from the Leamington Spa Courier, 20 February 1847

In order to 'clean' and sort through the ‘muddied’ OCR and the ‘clean’ OCR, we need to teach the computer what is ‘positive text’ (i.e., language that uses the word ‘abolitionist’, ‘black’, ‘fugitive’, ‘negro’) and ‘negative text’ (language that does not relate to abolition). For example, the image to the left shows an advert for one of Frederick Douglass’s lectures (Leamington Spa Courier, 20 February 1847). The key words in this particular advert that are likely to appear in other adverts, reports and commentaries are ‘Frederick Douglass’, ‘fugitive’, ‘slave’, ‘American’, and ‘slavery.’ I can search for this advert through the digitised database, but there are perhaps hundreds more waiting to be uncovered.
We found examples where the name ‘Frederick’ had been ‘read’ as F!e83hrick or something similar. The image below shows some OCR from the Aberdeen Journal, 5 February 1851, and an article about “three fugitive slaves.” The term ‘Fugitive Slaves’ as a heading is completely illegible, as is William’s name before ‘Crafts.’ If I used a search engine to search for William Craft, it is unlikely this result would be highlighted because of the poor OCR.

Ocr-text
OCR from the Aberdeen Journal, 5 February 1851, and an article about “three fugitive slaves.”

I have spent several years transcribing black abolitionist speeches and most of this will act as the ‘positive’ text. ‘Negative’ text can refer to other lectures of a similar structure but do not relate to abolition specifically, for example prison reform meetings or meetings about church finances. This will ensure the abolitionist language becomes easily readable. We can then test the performance of this against some of the data we already have, and once the probability ensures we are on the right track, we can apply it to a larger data set.

All of this data is built into what is called a classifier, created by Ben O’Steen, Technical Lead of BL Labs. This classifier will read the OCR and collect newspaper references, but works differently to a search engine because it measures words by weight and frequency. It also relies on probability, so for example, if there is an article that mentions fugitive and slave in the same section, it ranks a higher probability that article will be discussing someone like Frederick Douglass or William Craft. On the other hand, a search engine might read the word ‘fugitive slave’ in different articles on the same page of a newspaper.

We’re currently processing the results of the classifier, and adjusting accordingly to try and reach a higher accuracy. This involves some degree of human effort while I double check the references to see whether the results actually contains an abolitionist speech. So far, we have had a few references to abolitionist speeches, but the classifier’s biggest difficulty is language. For example, there were hundreds of results from the 1830s and the 1860s – I instantly knew that these would be references around the Chartist movement because the language the Chartists used would include words like ‘slavery’ when describing labour conditions, and frequently compared these conditions to ‘negro slavery’ in the US. The large number of references from the 1860s highlight the renewed interest in American slavery because of the American Civil War, and there are thousands of articles discussing the Union, Confederacy, slavery and the position of black people as fugitives or soldiers. Several times, the results focused on fugitive slaves in America and not in Britain.

Another result we had referred to a West Indian lion tamer in London! This is a fascinating story and part of the hidden history we see as a central part of the project, but is obviously not an abolitionist speech. We are currently working on restricting our date parameters from 1845 to 1860 to start with, to avoid numerous mentions of Chartists and the War. This is one way in which we have had to be flexible with the initial proposal of the project.

Aside from the work on the classifier, we have also been working on numerous ways to improve the OCR – is it better to apply OCR correction software or is it more beneficial to completely re-OCR the collection, or perhaps a combination of both? We have sent some small samples to a company based in Canberra, Australia called Overproof, who specialise in OCR correction and have provided promising results. Obviously the results are on a small scale but it’s been really interesting so far to see the improvements in today’s software compared to when some of these newspapers were originally scanned ten years before. We have also sent the same sample to the IMPACT centre for competence of Competence in Digitisation whose mission is to make the digitisation of historical printed text “better, faster, cheaper” and provides tools, services and facilities to further advance the state-of-the-art in the field of document imaging, language technology and the processing of historical text. Preliminary results will be presented at the Labs Symposium.

Updated website

Before I started working with the Library, I had designed a website at http://www.frederickdouglassinbritain.com. The structure was rudimentary and slightly awkward, dwarfed by the numerous pages I kept adding to it. As the project progressed, I wanted to improve the website at the same time, and with the invaluable help of Dr Mike Gardner from the University of Nottingham, I re-launched my website at the end of October. Initially, I had two maps, one showing the speaking locations of Frederick Douglass, and another map showing speaking locations by other black abolitionists such as William and Ellen Craft, William Wells Brown and Moses Roper (shown below).

Website-update-maps
Left map showing the speaking locations of Frederick Douglass. Right map showing speaking locations by other black abolitionists such as William and Ellen Craft, William Wells Brown and Moses Roper.

After working with Mike, we not only improved the aesthetics of the website and the maps (making them more professional) but we also used clustering to highlight the areas where these men and women spoke the most. This avoided the ‘busy’ appearance of the first maps and allowed visitors to explore individual places and lectures more efficiently, as the old maps had one pin per location. Furthermore, on the black abolitionist speaking locations map (below right), a user can choose an individual and see only their lectures, or choose two or three in order to correlate patterns between who gave these lectures and where they travelled. 

Website-update-maps-v2
The new map interface for my website.

Events

I am very passionate about public engagement and regard it as an essential part of being an academic, since it is so important to engage and share with, and learn from, the public. We have created two events: as part of Black History Month on the 6th October, we had a performance here at the Library celebrating the life of two formerly enslaved individuals named William and Ellen Craft. Joe Williams of Heritage Corner in Leeds – an actor and researcher who has performed as numerous people such as Frederick Douglass and the black circus entertainer Pablo Fanque – had been writing a play about the Crafts, and because it fitted so well with the project, we invited Joe and actress Martelle Edinborough, who played Ellen, to London for a performance. Both Joe and Martelle were incredible and it really brought the Craft’s story and the project to life. We had a Q&A afterwards where everyone was very responsive and positive to the performance and the Craft’s story of heroism and bravery.

Hannah-murray-actors
(Left to Right) Martelle Edinborough, Hannah-Rose Murray and Joe Williams

The next event is a walking tour, taking place on Saturday 26 November. I’ve devised this tour around central London, highlighting six sites where black activists made an indelible mark on British society during the nineteenth century. It is a way of showing how we walk past these sites on a daily basis, and how we need to recognise the contributions of these individuals to British history.

Hopefully this project will inspire others to research and use digital scholarship to find more ‘hidden voices’ in the archive. In terms of black history specifically, people of colour were actors, sailors, boxers, students, authors as well as lecturers, and there is so much more to uncover about their contribution to British history. My personal journey with the Library and the Labs team has also been a rewarding experience. It has further convinced me that we need stronger networks of collaboration between scholars and computer scientists, and the value of digital humanities in general. Academics could harness the power of technology to bring their research to life, an important and necessary tool for public engagement. I hope to continue working with the Labs team fine-tuning some of the results, as well as writing some pages about black abolitionists for the new website. I’m very grateful to the Library and the Labs team for their support, patience, and this amazing opportunity as I’ve learned so much about digital humanities, and this project – with its combination of manual and technological methods – as a larger model for how we should move forward in the future. The project will shape my career in new and exciting ways, and the opportunity to work with one of the best libraries in the world is a really gratifying experience.

I am really excited that I will be there in London in a few days time to present my findings, why don't you come and join us at the British Library Labs Symposium, between 0930 - 1730 on Monday 7th of November, 2016?

20 September 2016

Black Abolitionists: Performance and Discussion for Black History Month by Hannah-Rose Murray

Posted by Mahendra Mahey on behalf of Hannah-Rose Murray, 2016 finalist of the BL Labs 2016 Competition.

To celebrate Black History Month in October 2016, you are welcome to attend an evening of performance on the 6th October, 7pm, hosted by the British Library Labs project and the Eccles Centre for American Studies in the Auditorium, Conference Centre, British Library, St Pancras, London, UK.

I am very lucky to be one of the finalists for the Labs Competition for 2016, and together we have organized an event that celebrates our project. Through my work with the Labs team, we are attempting to use machine learning to search through the digitized newspaper collections to access black abolitionist speeches and performances that have never been discovered before (read more here). This stems from my PhD project, which focuses on African Americans in Britain during the nineteenth century and the myriad ways they resisted British racism.

Two of the individuals I study are William and Ellen Craft, and we are really pleased to be working with two performers who will bring this incredible history to light on the evening of the 6th.

Ellen_craft
Ellen Craft dressed as a man to escape from slavery. Image from "The Underground Railroad from Slavery to Freedom" 2nd ed.,

William and Ellen Craft were born enslaved in Georgia. Ellen worked as a house servant, and when she was 20, married William (although by law in the South slave marriages were not legal.) They were determined to escape as they were fearful their master would sell them separately further South and they did not want to raise children in slavery. In 1848, they devised an ingenious escape plan: Ellen would pose as a gentleman with William as her manservant, and they would catch a series of trains and steamboats to the North. Ellen was fair-skinned, which was a result of her mother’s rape by her master, the plantation owner. Ellen could thus pass for a white person, but she could not read or write. To overcome this, Ellen strapped a bandage to her right hand to give her a reason not to be able to write just in case she was asked. This was an incredibly dangerous mission to accomplish - if caught, both William and Ellen would have been tortured and most certainly separated to different parts of the South, never to see each other again. It is a testimony to their bravery they managed to succeed.


For a short time, the Crafts settled in Boston but legally they were still enslaved in the eyes of the American government. When slave catchers threatened to steal them back into slavery, they set sail for England where they remained for over a decade. The Crafts soon became part of an abolitionist network in which hundreds of African Americans travelled to Britain to lecture against slavery, raise money to purchase enslaved family members or to live in Britain relatively safely from the violence they experienced in America. British audiences were fascinated by their incredible escape attempt, and were shocked that a ‘white’ person like Ellen could ever have been enslaved. Both William and Ellen travelled around Britain to educate Britons about the true nature of slavery and demanded their support in helping Americans abolish it.

During the evening, performer and writer Joe Williams will play William Craft. Joe has an MA from Leeds University’s School of Performance and Cultural industries and is the founder of Heritage Corner, which focuses on African narratives in British history. He has written performed works on leading abolitionists as well as on Victorian circus genius Pablo Fanque.

Martelle Edinborough will play Ellen Craft. Martelle has stage, film and television credits that include commercials and short films. Martelle has recently worked with the Leeds based Geraldine Connor Foundation on Forrest Dreaming and Chicken Shop Shakespeare’s contribution to this year’s Ilkley Literature Festival.

There will be a short welcome and introduction to the Crafts, and after which the performance will commence for an hour, with time for a Q&A afterwards.

Tickets are £8 (with some concessions available), and available here.

Please note a small number of free seats are available for community residents in Camden (London, England). If you think you are eligible, please contact Emma Morgan, Community Engagement Manager at the British Library at [email protected].

28 January 2016

Book Now! Nottingham @BL_Labs Roadshow event - Wed 3 Feb (12.30pm-4pm)

Do you live in or near Nottingham and are you available on Wednesday 3 Feb between 1230 - 1600? Come along to the FREE UK @BL_Labs Roadshow event at GameCity and The National Video Game Arcade, Nottingham (we have some places left and booking is essential for anyone interested).


BL Labs Roadshow in Nottingham - Wed 3 Feb (1200 - 1600)
BL Labs Roadshow at GameCity and The National Video Game Arcade, Nottingham, hosted by the Digital Humanities and Arts (DHA) Praxis project based at the University of Nottingham, Wed 3 Feb (1230 - 1600)
  • Discover the digital collections the British Library has, understand some of the challenges of using them and even take some away with you.
  • Learn how researchers found and revived forgotten Victorian jokes and Political meetings from our digital archives.
  • Understand how special games and computer code have been developed to help tag un-described images and make new art.
  • Find out about a tool that links digitised handwritten manuscripts to transcribed texts and one that creates statistically representative samples from the British Library’s book collections.
  • Consider how the intuitions of a DJ could be used to mix and perform the Library's digital collections.
  • Talk to Library staff about how you might use some of the Library's digital content innovatively.
  • Get advice, pick up tips and feedback on your ideas and projects for the 2016 BL Labs Competition (deadline 11 April) and Awards (deadline 5 September). 

Our hosts are the Digital Humanities and Arts (DHA) Praxis project at the University of Nottingham who are kindly providing food and refreshments and will be talking about two amazing projects they have been involved in:

ArtMaps: putting the Tate Collection on the map project
ArtMaps: Putting the Tate Collection on the map

Dr Laura Carletti will be talking about the ArtMaps project which is getting the public to accurately tag the locations of the Tate's 70,000 artworks.

The 'Wander Anywhere' free mobile app developed by Dr Benjamin Bedwell.

Dr Benjamin Bedwell, Research Fellow at the University of Nottingham will talk about the free mobile app he developed called 'Wander Anywhere'.  The mobile software offers users new ways to experience art, culture and history by guiding them to locations where it downloads stories intersecting art, local history, architecture and anecdotes on their mobile device relevant to where they are.

For more information, a detailed programme and to book your place, visit the Labs and Digital Humanities and Arts Praxis Workshop event page.

Posted by Mahendra Mahey, Manager of BL Labs.

The BL Labs project is funded by the Andrew W. Mellon Foundation.

27 January 2016

Come to our first @BL_Labs Roadshow event at #citylis London Mon 1 Feb (5pm-7.30pm)

Labs Roadshow at #citylis London, Mon 1 Feb (5pm-7.30pm)

Live in or near North-East London and are available on Monday 1 Feb between 1700 - 1930? Come along to the first FREE UK Labs Roadshow event of 2016 (we have a few places left and booking is essential for anyone interested) and:

#citylis London BL Labs London Roadshow Event Mon 1 Feb (1730 - 1930)
#citylis at the Department for Information ScienceCity University London,
the first BL Labs Roadshow event Mon 1 Feb (1700 - 1930)
  • Discover the digital collections the British Library has, understand some of the challenges of using them and even take some away with you.
  • Learn how researchers found and revived forgotten Victorian jokes and Political meetings from our digital archives.
  • Understand how special games and computer code have been developed to help tag un-described images and make new art.
  • Talk to Library staff about how you might use some of the Library's digital content innovatively.
  • Get advice, pick up tips and feedback on your ideas and projects for the 2016 BL Labs Competition (deadline 11 April) and Awards (deadline 5 September). 

Our first hosts are the Department for Information Science (#citylis) at City University London. #citylis have kindly organised some refreshments, nibbles and also an exciting student discussion panel about their experiences of working on digital projects at the British Library, who are:

#citylis student panel  Top-left, Ludi Price and Top-right, Dimitra Charalampidou Bottom-left, Alison Pope and Bottom-right, Daniel van Strien
#citylis student panel.
Top-left, Ludi Price 
Top-right, Dimitra Charalampidou
Bottom-left, Alison Pope
Bottom-right, Daniel van Strien

For more information, a detailed programme and to book your place (essential), visit the BL Labs Workshop at #citylis event page.

Posted by Mahendra Mahey, Manager of BL Labs.

The BL Labs project is funded by the Andrew W. Mellon Foundation.

22 January 2016

BL Labs Competition and Awards for 2016

Today the Labs team is launching the fourth annual Competition and Awards for 2016. Please help us spread the word by tweeting, re-blogging, and telling anyone who might be interested!

British Library Labs Competition 2016

The annual Competition is looking for transformative project ideas which use the British Library’s digital collections and data in new and exciting ways. Two Labs Competition finalists will be selected to work 'in residence' with the BL Labs team between May and early November 2016, where they will get expert help, access to the Library’s resources and financial support to realise their projects.

Winners will receive a first prize of £3000 and runners up £1000 courtesy of the Andrew W. Mellon Foundation at the Labs Symposium on 7th November 2016 at the British Library in London where they will showcase their work.

The deadline for entering is midnight British Summer Time (BST) on 11th April 2016.

Labs Competition winners from previous years have produced an amazing range of creative and innovative projects. For example:

(Top-left)  Adam Crymble's Crowdsource Arcade (Bottom-left) Katrina Navickas' Political Meetings Mapper and (Right) Bob Nicholson's Mechanical Comedian.
(Top-left) Adam Crymble's Crowdsource Arcade and some specially developed games to help with tagging images
(Bottom-left) Katrina Navickas' Political Meetings Mapper and a photo from a Chartist re-enactment 
(Right) Bob Nicholson's Mechanical Comedian

A further range of inspiring and creative ideas have been submitted in previous years and some have been developed further.

British Library Labs Awards 2016

The annual Awards, introduced in 2015, formally recognises outstanding and innovative work that has been carried out using the British Library’s digital collections and data. This year, they will be commending work in four key areas:

  • Research - A project or activity which shows the development of new knowledge, research methods, or tools.
  • Commercial - An activity that delivers or develops commercial value in the context of new products, tools, or services that build on, incorporate, or enhance the Library's digital content.
  • Artistic - An artistic or creative endeavour which inspires, stimulates, amazes and provokes.
  • Teaching / Learning - Quality learning experiences created for learners of any age and ability that use the Library's digital content.

A prize of £500 will be awarded to the winner and £100 for the runner up for each category at the Labs Symposium on 7th November 2016 at the British Library in London, again courtesy of the Andrew W. Mellon Foundation.

The deadline for entering is midnight BST on 5th September 2016.

The Awards winners for 2015 produced a remarkable and varied collection of innovative projects in  Research, Creative/Artistic, Entrepreneurship categories and a special Jury's prize:

(Top-left) Spatial Humanities research group at the University Lancaster,  (Top-right) A computer generated work of art, part of  'The Order of Things' by Mario Klingemann,  (Bottom-left) A bow tie made by Dina Malkova  and (Bottom-right) work on Geo-referenced maps at the British Library that James Heald is still involved in.
(Top-left) Spatial Humanities research group at the University Lancaster plotting mentions of disease in newspapers on a map in Victorian times,
(Top-right) A computer generated work of art, part of 'The Order of Things' by Mario Klingemann,
(Bottom-left) A bow tie made by Dina Malkova inspired by a digitised original manuscript of Alice in Wonderland
(Bottom-right) Work on Geo-referencing maps discovered from a collection of digitised books at the British Library that James Heald is still involved in.
  • Research: “Representation of disease in 19th century newspapers” by the Spatial Humanities research group at Lancaster University analysed the British Library's digitised London based newspaper, The Era through innovative and varied selections of qualitative and quantitative methods in order to determine how, when and where the Victorian era discussed disease.
  • Creative / Artistic:  “The Order of Things” by Mario Klingemann involved the use of semi-automated image classification and machine learning techniques in order to add meaningful tags to the British Library’s one million Flickr Commons images, creating thematic collections as well as new works of art.
  • Entrepreneurship: “Redesigning Alice” by Dina Malkova produced a range of bow ties and other gift products inspired by the incredible illustrations from a digitised British Library original manuscript of Alice's Adventures Under Ground by Lewis Carroll and sold them through the Etsy platform and in the Alice Pop up shop at the British Library in London.
  • Jury's Special Mention: Indexing the BL 1 million and Mapping the Maps by volunteer James Heald describes both the work he has led and his collaboration with others to produce an index of 1 million 'Mechanical Curator collection' images on Wikimedia Commons from the British Library Flickr Commons images. This gave rise to finding 50,000 maps within this collection partially through a map-tag-a-thon which are now being geo-referenced.

A further range of inspiring work has been carried out with the British Library's digital content and collections.

If you are thinking of entering, please make sure you visit our Competition and Awards archive pages for further details.

Finally, if you have a specific question that can't be answered through these pages, feel free to contact us at [email protected], or why not come to one of the 'BL Labs Roadshow 2016' UK events we have scheduled between February and April 2016 to learn more about our digital collections and discuss your ideas?

We really look forward to reading your entries!

Posted by Mahendra Mahey, Manager of British Library Labs.

The British Library Labs project is funded by the Andrew W. Mellon Foundation.


Digital scholarship blog recent posts

Archives

Tags

Other British Library blogs